
Digital Exclusive: Condensation-induced liquid hammering
R. VAID, Worley Services India Pte. Ltd., Mumbai, India
Condensation-induced water hammering (CIWH) is a dangerous event that mostly happens in steam systems. Many operators and supervisors believe water hammer results from condensate heating and flashing to steam because they hear bubbles popping like popcorn, commonly during plant heat up. However, the reverse is happening, as steam admitted to the pipe is being suddenly condensed by the relatively cold condensate where rapid steam condensation—often due to a void or pool of cold water—creates an extreme pressure wave.
When steam contacts cold condensate, the steam condenses, drawing more steam to fill the resulting vacuum. However, the condensate pool is toward that vacuum. The Bernoulli Effect creates a shockwave in the condensate pool. If that wave grows to seal the pipe, the water wave begins to accelerate towards the void more rapidly. That vacuum created by the sudden condensing steam accelerates the condensate towards the vacuum, which travels at a very high velocity up to 70 mph. If even 1 gal of water (~8 lbs.) is travelling 70 mph through a pipe and hits an obstruction (e.g., pipe bend, tee, closed valve), damage to the system could be catastrophic.
This risk is not just limited to steam systems. Condensation-induced liquid hammering (CILH) can happen in any high temperature system, where heat transfer takes place and the handled liquid is not water.
Methods and materials. The impact of CILH can be estimated by a few theoretical study methods such as performing numerical simulations using computational fluid dynamics (CFD), system-level analysis with one-dimensional thermal-hydraulic codes, analytical modeling based on dimensionless parameters and experimental studies with the help of a theoretical study. However, performing such high-level studies requires ample amount of data and time. CILH can be predicted by analyzing a system closely with the help of a computational hydraulic transient study or, in other words, by performing a surge analysis/water hammer study using the Joukowsky equation with the help of computational software tools for liquid systems; computational tools can be used for performing computational dynamic/transient analysis for multiphase systems.
Surge analysis is performed to estimate the maximum and minimum surge pressures and forces generated in the system due to the sudden closure of active valves, startup, sudden tripping of the source pump or any possible uncertain hydraulically dynamic scenario. If the calculated surge pressures or surge forces exceed the maximum allowable limits, then appropriate recommendations are provided to mitigate the risks of overpressure and excessive stress loads for all the pipe sections within the circuit under consideration.
This article will explain a way of predicting the occurrence of CILH in a liquid (hydrocarbon) system, with the help of the observations and results of the surge analysis (water hammer study) for the liquid system under consideration.
The following example will detail how CILH can be predicted with the help of a water hammer study.
A liquid (hydrocarbon) system was considered for conducting a surge analysis water hammer study using the Joukowsky equation, with the help of a computational transient hydraulic toola.
The Joukowsky equation (Eq. 1) is a formula used for calculating the maximum and minimum surge pressure in a pipe system due to the water hammer effect during possible dynamic/uncertain events of the system.
∆P = –ρc∆V (1)
Where:
∆P is the pressure change during the considered surge event
ρ is the density of the fluid handled in the system
c is the wave speed (sonic velocity)
∆V is the change in fluid velocity.
System geometry. A distillation unit of a refinery, a fluid is stripped in a distillation column, and the bottom product (saturated liquid) is cooled in a shell-and-tube heat exchanger where the column’s feed is preheated on the cold side of the heat exchanger using the heat of the bottom stripped product on the hot side of the exchanger. The schematic of the distillation system is shown in FIG. 1.

FIG. 1. Schematic of the distillation system.
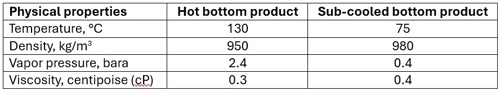
Steady state conditions. The stripper column’s bottom product pump (centrifugal pump) transfers the stripped bottom product at a rate of approximately 18,000 kg/hr during normal operation. The column’s bottom product enters the heat exchanger at an inlet temperature of 130°C which gets cooled to 75°C in the heat exchanger. Physical properties of the fluid are shown below in TABLE 1.
The system shown in FIG. 1 was modeled in proprietary computational hydraulic transient softwareb as per the data (pipe size, length, elevation, fittings, valves, piping specialty items) from the piping model of the system. The valve opening/closure profile considered was per vendor valve data. The stripper column’s bottom product pump operating curve was plotted as an input in the softwareb for the pump operating range. The pressure drop for the heat exchanger was considered per vendor data.
The graphical representation of the steady-state pressure profile, with respect to the elevation of the distillation system, is shown in FIG. 2. This depiction shows two graphical representations: one for the static pressure of the system (in barg) during steady-state (normal) operation, and the elevation profile [in meters (m)] of the system. In other words, FIG. 2 shows a general representation of how the system pressure changes with respect to elevation. In addition, the rise in pressure at the beginning of the graph is due to the pump discharge pressure.
 FIG. 2. Steady-state pressure profile with respect to system elevation.
Transient scenario. For the system under consideration surge analysis study is performed for the sudden trip/failure of stripper column bottom product pump. In this scenario, sudden trip of the pump is considered. All other valves in the system are considered to have no impact on this pump trip scenario. AFT Impulse calculates pump trip time based on the pump's rotational inertia and the deceleration rate after a power loss, determining how quickly the pump speed drops to zero and impacting the hydraulic response in the system.
Results of the hydraulic response with respect to pump trip scenario are analyzed further in the section below.
Results and discussion. Transient results depict that the maximum transient pressure and dynamic forces for this scenario are well within the maximum allowable surge limit for the entire circuit. However, there is cavitation in the system during the surge event. To identify the reason for this cavitation, the minimum surge pressure (negative pressure) profile across the system was analyzed. A graphical representation of the minimum surge pressure is shown in FIG. 3.

FIG. 3. Transient pressure (surge pressure) profile.
As shown in FIG. 3, the minimum surge pressure (2.26 bara) has gone below the vapor pressure of the fluid (2.4 bara). When the stripper column’s bottom product pump gets tripped, there is no discharge pressure from the pump, and the system pressure completely depends on the static pressure. As there is no discharge pressure from the pump, the system tries to go to equilibrium, resulting in the reduction of the system’s pressure until it reaches static pressure. During this equilibrium process, the moment when system pressure goes below the vapor pressure of the liquid, the liquid starts to vaporize, forming a vapor cavity in the circuit. In this system, the liquid, until the heat exchanger inlet, is a saturated liquid which is at a temperature very close to its boiling point. So, the chance of flashing this liquid due to low system pressure is extremely high in the piping from the pump discharge until the heat exchanger.
FIG. 3 shows that at 64.279 m from the stripper column in the piping circuit, the system static pressure is the lowest—1.257 barg (2.26 bara)—which is lower than the vapor pressure of the liquid (2.4 bara). This shows that the cavitation in the system during the pump trip is initiated at this point. While searching for this point in the piping model, it was found that this point is the inlet of the heat exchanger.
The following will compare the system pressure’s behavior during dynamic state (pump trip) with respect to the elevation of piping of the system (FIG. 4).

FIG. 4. Elevation profile of the system.
As shown in FIG. 4, the elevation of the point where cavitation is occurring is at an elevation of 17.2 m from grade. While locating this point in the piping model of the system, it was observed that this point is the inlet of the heat exchanger which is located at an elevation of 17.2 m from grade. A piping elevation of 17.2 m is quite high for a system handling saturated liquid (liquid at its boiling point). However, the volume of the vapor cavity and the time for which it lasts in the system’s piping will decide whether this cavitation is an actual risk for the system or not.
To find out the maximum vapor volume (pocket size) of this cavity, further analysis was completed by analyzing the vapor volume profile in the piping during this transient scenario of the pump trip.
FIG. 5 shows the vapor volume profile in the system during this transient scenario of pump trip.

FIG. 5. Vapor volume profile of the system.
As shown in FIG. 5, the vapor cavity volume is largest in the piping at 64.28 m—i.e., the inlet of the heat exchanger. The vapor volume is considerable (approximately 78 liters), which is quite large for a 4-in. diameter pipe. Therefore, this vapor volume is a risk for this system.
However, the risk is not limited to the immediate collapse of this vapor cavity due to liquid column separation and rebuilding. There is a much more severe risk of CILH due to this vapor cavity formation. Hence, it is necessary to check the time period for which this vapor cavity lasts in the system. With the help of a graphical representation, the following will try to understand the behavior of this vapor cavity. FIG. 6 shows a graph of vapor volume in the heat exchanger’s inlet pipe vs. time.

FIG. 6. Vapor volume in the heat exchanger’s inlet pipe vs. time.
As evident from FIG. 6, the vapor volume starts to increase as soon as the pump trips and continues to increase until the end of the transient event. This behavior of the vapor cavity clearly shows that it is a persistent cavitation which does not occur due to liquid column breaking caused by the sudden change in velocity due to a transient event, as the vapor cavity is not collapsing with time, and the vapor pocket size continued to increase with time. Therefore, it is evident that this vapor cavity remains in the system for a considerable period even after the end of the transient event. This increases the chances of a CILH occurrence. Although the transient analysis results may not show surge peaks from vapor pocket collapse, ongoing heat absorption by the heat exchanger/cooler may eventually cause vapor condensation.
As this vapor cavity formation happened at the inlet of the hot side of the heat exchanger, this cavity enters the heat exchanger where cold side liquid flow is continuously flowing, providing cooling to this vapor cavity. This cooling effect causes the vapor cavity to instantly collapse due to condensation. The sudden drop in specific volume (as liquid occupies nearly 1,000 times less volume than vapor) can result in a void formation in the piping. The liquid on the upstream end of the broken liquid column rushes into this void, creating high-velocity impacts between liquid columns that generate a shockwave and high-pressure peaks.
These pressure peaks can even go higher than the hydrostatic test pressure of the piping which can break the pipe, as well as damage the equipment (heat exchanger) if it exceeds the MAWP or the test pressure of the equipment.
Takeaways. Depending on the vapor pocket size, the resulting CIWH surge may move pipe supports, cause significant vibration or in extreme cases, lead to LOPC, putting system integrity at risk. Also, it can lead to serious injuries or even fatalities. However, calculating the amount of energy needed to condense an isolated vapor pocket, trigger the collision of liquid columns and determine the resulting pressure surge is quite challenging. Estimating how long this sequence takes is even more difficult. In most cases, accurately modeling such scenarios requires the use of FEA software.
In the absence of these advanced tools, personnel can only assess the potential risk when facing such a phenomenon. For instance, high-pressure systems or systems with significant heating/cooling loads carry a higher risk. The risk is also directly influenced by the amount of vapor generated and subsequently trapped in the system.
The following are mitigation or preventive measures to avoid CILH, or, at least, to reduce the damage that can occur due to CILH/CIWH for the system mentioned in this article. The following are mitigation pathways to avoid CILH:
- Avoid running piping at high elevations which will cause the static pressure of the system to go below the vapor pressure of the fluid, causing cavitation during a transient event like the sudden trip of a pump.
- Provide control safeguarding which will stop the flow of cooling utility to the heat exchanger or stop the cooler (air cooler) which will not let the vapor cavity form during a transient event.
- Conduct a few trials using FEA tools based on certain considerations and try to evaluate the chances of a CILH occurrence in the system during any such uncertainty, such as a sudden pump trip or plant breakdown.
- Make sure that a proper draining facility is provided, and draining should be done after every such uncertain breakdown event to remove the accumulated condensed fluid from the circuit.
NOTE
a Datacor
b Datacor Impulse
REFERENCES
1 U.S. Chemical Safety and Hazard Investigation Board, “Safety bulletin No. 2010-13-A-AL: Key lessons for preventing hydraulic shock in industrial refrigeration systems—Anhydrous ammonia release at Millard Refrigeration Services, Inc.,” January 2015.


Comments