
May 2026
Sustainability and The Energy Transition
Achieve emissions reductions with a low-carbon solution: Insights from energy analysis
The chemical process industries are increasingly focused on reducing their carbon footprint through a range of technologies, including green and renewable energy, carbon capture and carbon dioxide (CO₂) sequestration. Among these strategies, enhancing energy efficiency has emerged as a critical pathway toward achieving carbon neutrality. Process integration, supported by advanced modeling and energy optimization, plays a key role in minimizing the environmental impact of industrial operations.
Major contributors to global greenhouse gas (GHG) emissions include power generation, fertilizer production and petroleum refining. Within the refining sector, the crude distillation unit (CDU) is a significant source of emissions due to its reliance on large process heaters. These heaters are essential for separating crude oil into its constituent fractions but also consume substantial fuel, resulting in high CO₂ and GHG emissions.1
Efforts to reduce emissions from CDUs typically focus on improving energy efficiency and deploying carbon capture solutions. Strategies such as enhancing process-to-process heat recovery, reducing heater duty and lowering stack gas temperatures can significantly cut fuel consumption and associated emissions.
This article presents a case study of a refinery’s CDU preheat train that achieved meaningful GHG reductions by increasing internal heat recovery. Using pinch analysis and energy integration techniques, the study optimized the heat exchanger network to minimize energy losses. A comprehensive evaluation of capital (CAPEX) and operational expenditures (OPEX), along with emissions and carbon tax implications, was conducted to assess the feasibility and impact of various retrofit scenario.
Background. A CDU preheat train featuring complex heat integration across multiple refinery processes was modeled using a proprietary process simulation softwarea. This integration spanned several plant units, including the CDU, the vacuum distillation unit (VDU) and the saturated gas plant. The system utilized various utilities such as fired heaters, brine exchangers, cooling water exchangers and air coolers.
A steady-state simulation was developed in the process simulation softwarea, and the data was exported to an energy management softwareb to optimize the heat exchanger network (HEN). The primary objective was to identify retrofit opportunities that enhance energy efficiency and reduce GHG emissions.
The study aimed to maximize heat recovery within process streams and raise the fired heater inlet temperature beyond the current 300°C (572°F). The outlet temperature to the CDU was maintained at 385°C (725°F) to ensure product quality and throughput. Increasing the inlet temperature reduces the fired heater duty, thereby lowering fuel consumption, emissions and associated carbon tax liabilities.
System description. As stated above, the system analyzed in this study comprises the preheat train of a CDU, integrated with a VDU and a saturated gas plant. Each CDU train includes 21 feed heat exchangers, five cooling exchangers and one fired heater. The study's findings are applicable to both identical CDU trains.
The unit processes a Middle Eastern heavy crude, with each train equipped with a dedicated desalter and a shared preflash column located upstream of the fired heater. The number and configuration of heat exchangers reflect the extent of heat recovery achieved, highlighting the complexity of the heat integration network. A simplified process flow diagram of the initial preheat train is provided in FIG. 1.

FIG. 1. Base configuration overview of the crude preheat train.
The crude unit feed is preheated through heat exchange with various process streams, including the atmospheric fractionator overhead, side draws, pumparounds and product streams from both the CDU and VDU. Cooling is provided by cooling water exchangers and air coolers, while final heating is supplied by a fired heater to achieve the target feed temperature required at the crude distillation column inlet.
Methodology. To conduct this assessment, the following methodology was employed:
- Developed a base-case simulation of the preheat train configuration using process simulation softwarea.
- Exported the process simulation softwarea model to the energy management softwareb for further analysis.
- Utilized energy management softwareb outputs—including composite curves, grand composite curves and driving force plots—to evaluate opportunities for enhanced heat recovery.
- Explored alternative scenarios aimed at increasing heat recovery potential.
- Generated cost curves and monitored improvements in the minimum temperature difference (DTmin) as it approached the target optimum.
- Assessed GHG emissions and the corresponding carbon tax implications.
The process simulation softwarea simulation was based on crude assay data and process constraints for individual streams involved in heat recovery. The crude feed enters the facility at 34°C (93°F), and several key temperature constraints were maintained throughout the analysis:
- Desalter inlet temperature: Maintained at 138°C (280°F)
- Preflash tower inlet temperature: Maintained at 200°C (392°F)
- Pumparound duties: Held constant relative to the Base Case.
All energy optimization efforts were conducted within these constraints. Additionally, battery limit temperatures were kept constant across all scenarios to ensure stable operation of downstream units and compliance with product storage specifications.
Simulation in the energy management softwareb. The energy management softwareb was used as the primary tool for this study. The base model of the preheat train was first developed using the process simulation softwarea in steady-state mode. The simulation data was then transferred to the energy management softwareb to evaluate and improve the performance of the HEN.
Within the energy management softwareb, composite curves for the heating and cooling streams were generated to assess the maximum potential for heat recovery and to establish the minimum utility requirements. As illustrated in FIG. 2, the temperature gap between the hot and cold composite curves at their closest points defines the minimum temperature difference, or DTmin. The overlap between the hot (red) and cold (blue) composite curves represents the maximum recoverable heat within the process. These curves also define the minimum hot and cold utility demands for a given DTmin.

FIG. 2. Energy management softwareb composite curve.
A smaller DTmin indicates closer curve proximity, which enhances heat recovery and reduces utility consumption, thereby lowering OPEX. However, this also necessitates a larger heat exchange area, increasing CAPEX. Conversely, a larger DTmin reduces the required heat exchange area (lower CAPEX) but increases utility usage and OPEX.
For the Base Case configuration, the hot and cold pinch temperatures were identified as 308°C (586°F) and 271°C (520°F), respectively, resulting in a DTmin of 37°C (99°F). The hot and cold utility requirements were 323 MMBtu/hr and 175 MMBtu/hr, respectively.
With the composite curves and the Base Case DTmin established, the next step was to explore opportunities for reducing the DTmin and enhancing heat recovery. A key tool in this analysis is the driving force plot, as illustrated in FIG. 3. This plot helps identify potential locations for increased heat recovery and efficiency.

FIG. 3. Energy management softwareb driving force plot.
In the driving force diagram, temperature points shown in black that align with the red baseline indicate areas where the energy targets are closely matched, suggesting efficient heat exchange. Conversely, gaps between the curves highlight regions with potential for improved integration. By analyzing these intervals, targeted modifications can be proposed to increase thermal efficiency and reduce utility consumption.
Analysis of the shifted temperature driving force plot reveals that the base design closely matches the target temperatures, indicating efficient heat exchange in several regions. However, opportunities for additional heat recovery were identified in two key areas:
- Near the cold end of the preheat train, where cold stream temperatures range from 130°C–150°C (266°F–302°F).
- Upstream of the atmospheric heater, where cold stream temperatures range from 280°C–300°C (536°F–572°F).
Using these insights from the energy management softwareb, alternative configurations were developed to enhance heat recovery in these zones. The goal was to incrementally raise the inlet temperature to the atmospheric heater to 302°C (576°F), 304°C (579°F), 306°C (583°F), 308°C (586°F) and 310°C (590°F), thereby reducing the heater duty and associated fuel consumption.
Another valuable tool in this analysis is the grand composite curve (GCC), shown in FIG. 4. Derived from the composite curves, the GCC plots temperature against the enthalpy difference between the hot and cold composite curves. It represents the net heating and cooling requirements of the process after all feasible process-to-process heat recovery has been accounted for.

FIG. 4. Energy management softwareb GCC.
The GCC is particularly useful for setting utility targets, as it clearly indicates:
- The minimum hot utility required and the temperature level at which it must be supplied. In this case, the GCC shows that hot utility is needed to reach 385°C (725°F) at the atmospheric fractionator inlet.
- The minimum cold utility required, with cooling needed down to 40°C (104°F).
Analyzing the GCC provides insight not only into the quantity of utility required, but also the specific temperature levels at which it must be supplied or removed, enabling more strategic utility integration and cost-effective process optimization.
The base configuration of the heat exchanger network in the energy management softwareb is shown in FIG. 5. In the heat exchanger network diagram, hot streams are represented as red colored horizontal lines extending to the right, while cold streams are represented in blue color that extend to the left. Heat exchangers are illustrated as vertical 'dumbbell' shapes connecting the hot and cold streams. Cooling utilities, such as cooling water and air coolers, are shown as blue streams at the top of the diagram, while heating utilities, including fuel gas for the fired heater, appear as red streams at the bottom of the diagram. The energy management softwareb model has been calibrated and validated against the process simulation software’sa steady-state simulation, ensuring consistency with the heat and material balance.
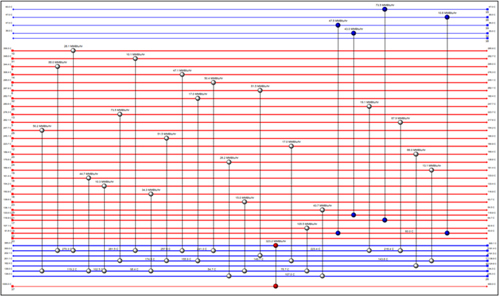
FIG. 5. Base configuration HEN in the energy management softwareb.
Optimum minimum approach DTmin from cost data. The optimum minimum approach the DTmin in an HEN represents the smallest allowable temperature difference between a heat source and a heat sink that enables effective heat transfer. While a lower DTmin typically increases heat recovery, it does not always result in a cost-effective or practically feasible network design.
The energy management softwareb can be used to generate a cost vs. DTmin curve, which helps identify the most economically viable DTmin based on project-specific CAPEX and OPEX, using the base configuration as a reference.
However, the cost curve generated by the energy management softwareb does not fully reflect all real-world design and operational constraints. Several of these limitations were outlined in the methodology section. For example, in this case, the use of refrigerants and steam as utility sources are excluded due to their unavailability at the plant site. Additionally, the design must remain straightforward, avoiding the introduction of additional split streams, which imposes further restrictions on the flexibility and complexity of the HEN configuration.
The cost curve generated by the energy management softwareb represents a theoretical relationship between the DTmin and the total cost of the HEN. However, this curve does not necessarily reflect a practical or implementable network configuration. The target optimum DTmin derived from the curve is a theoretical value that may not be achievable under real-world constraints.
To reach this theoretical DTmin, the energy management softwareb often proposes configurations involving a significantly higher number of heat exchangers, typically two to three times more than the current setup and includes multiple split streams, as well as the use of refrigerants and steam. However, in this study, the use of refrigerants and steam is excluded due to their unavailability at the plant site. Additionally, the design must remain simple, avoiding complex modifications such as additional split streams.
Therefore, the primary purpose of the cost curve in the study is to establish two key benchmarks:
- The DTmin of the existing (Base Case) design.
- The theoretical target optimum DTmin that minimizes total cost.
It is important to note that setting a target optimum DTmin does not guarantee its feasibility. The objective is to improve heat recovery as much as possible within the given constraints, moving closer to the theoretical optimum.
The DTmin value directly influences the trade-off between capital and operating costs:
- Increasing the DTmin reduces the required heat exchanger surface area, lowering CAPEX, but increases utility consumption, increasing OPEX.
- Decreasing the DTmin enhances heat recovery and reduces utility usage (lower OPEX), but requires a larger heat exchange area, increasing CAPEX.
- An optimum DTmin exists where the combined CAPEX and OPEX are minimized.
Based on project-specific cost data, the cost curve shown in FIG. 6 indicates that the optimum DTmin for the existing HEN is 21°C, while the Base Case operates at 37°C. This gap highlights a clear opportunity to improve heat recovery and achieve meaningful energy savings.

FIG. 6. Base configuration cost curve and optimum DTmin.
HEN options to improve process heat integration and lower fired heater duty. The cost curve highlights the potential for ideal energy savings at an optimum target minimum DTmin of 21°C (70°F). However, achieving this theoretical energy target must be balanced against practical considerations such as CAPEX, design complexity and plot plan constraints.
Considering the previously defined limitations (e.g., the exclusion of refrigerants and steam) and the need to avoid complex split-stream configurations, five potential strategies were identified to improve the HEN. These strategies include:
- Incremental adjustments to the temperature profile within the existing network.
- Modifications to the network configuration, such as adding new exchangers or increasing the heat transfer area of existing units.
In this study, five retrofit scenarios were evaluated, each aiming to incrementally raise the fired heater inlet temperature from 300°C (572°F) to 310°C (590°F). For each scenario, the corresponding DTmin was determined by generating hot and cold composite curves using the energy management softwareb, based on the modified HEN configurations. For clarity, only two composite curve options are presented in FIG. 7, as the curves are closely spaced and difficult to distinguish when shown together.

FIG. 7. Composite curve and DTmin for improved HEN options.
While the hot composite curve remains unchanged, the cold composite curves for the five evaluated options shift upward, indicating improved DTmin values and enhanced heat recovery. However, due to the close proximity of these curves, only the composite curves for Options 2 and 4 are shown in FIG. 7 for clarity.
The composite curves in FIG. 7 illustrate that as the fired heater inlet temperature increases, the DTmin moves closer to the target (ideal) DTmin. This results in greater process heat recovery, a higher inlet temperature to the fired heater and a corresponding reduction in fired heater duty. Consequently, both hot and cold utility requirements decrease, leading to improved energy efficiency.
The cost curve depicting total cost vs. DTmin for all five options is presented in FIG. 8. This plot demonstrates that as the DTmin approaches the target value, the total annual cost decreases, driven by a reduction in OPEX, even though CAPEX increases due to the need for larger heat exchange areas. It is important to note that this cost curve is based on the base configuration project cost and does not account for the design constraints discussed earlier. Therefore, the cost for each HEN option was calculated individually within the energy management softwareb to reflect realistic implementation scenarios.

FIG. 8. Cost curve and improvement in DTmin.
Evaluation of various HEN options. The first two retrofit options targeting fired heater inlet temperatures of 302°C (576°F) and 304°C (579°F) were developed by retaining the existing network design while increasing the shell area of selected exchangers. This was achieved by shifting heat duties from upstream of the desalter to downstream of the preflash tower, allowing greater heat recovery from exchangers that were previously constrained by pinch conditions. As a result, both cooling duty and fired heater duty were reduced, and the DTmin improved from 37°C (97°F) to 34°C (93°F), moving closer to the target. These modifications required an increase in heat transfer area and the addition of extra shells.
The remaining three options targeting 306°C (583°F), 308°C (586°F) and 310°C (590°F) fired heater inlet temperatures focused on exchangers located near the pinch point, particularly those closest to the fired heater. The pinch point represents the minimum temperature difference between hot and cold streams and is critical for minimizing utility requirements. To enhance energy recovery, additional heat transfer area was introduced across these pinch exchangers, and heat duties were maximized from the hottest available process streams.
Since the pinch exchangers were already operating at maximum area and shell capacity, new heat exchangers were added downstream of the preflash tower to extract additional heat. This combination of duty shifting and network expansion significantly increased the fired heater inlet temperature and further reduced the fired heater duty. The DTmin improved to 28°C (82°F), and cooling duty continued to decline across all five options.
FIG. 9 presents the relationship between the DTmin and the total heat transfer area for all five scenarios. The plot illustrates that achieving a fired heater inlet temperature of 310°C (590°F) requires a 26% increase in total heat transfer area, resulting in a 9°C (48°F) improvement in DTmin. However, reaching the theoretical target DTmin of 21°C (70°F) would demand a substantially larger heat transfer area, rendering it economically and practically unfeasible.
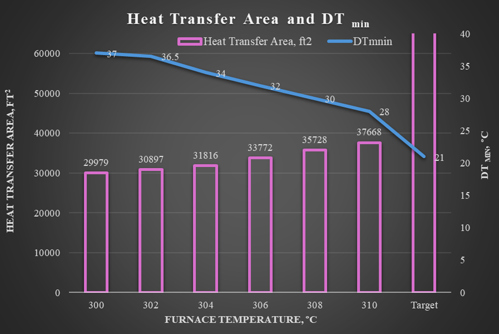
FIG. 9. Heat transfer area and improvement in DTmin for various HEN options.
FIG. 10 illustrates the reduction in both cooling and heating utility requirements across the five HEN optimization scenarios. The hot utility demand decreased from 323 MMBtu/hr in the Base Case to 292 MMBtu/hr, approaching the target of 272 MMBtu/hr. Similarly, the cold utility requirement dropped from 165 MMBtu/hr to 130 MMBtu/hr, moving closer to the target of 124 MMBtu/hr.
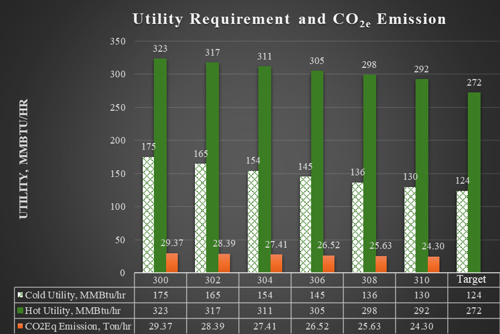
FIG. 10. Hot utility and cold utility savings for various HEN options.
These improvements in utility efficiency also led to a significant environmental benefit, with CO₂ emissions reduced by > 5 tons per hour (t/hr), contributing to lower OPEX and a reduced carbon footprint.
FIG. 11 presents the energy savings and the corresponding reduction in CO₂ emissions for each of the five HEN optimization options. In most cases, the reduction in emissions is directly proportional to the energy savings achieved. For example, in Option 2, where the fired heater inlet temperature is increased to 304°C (579°F), both energy savings and CO₂ emissions reductions reach approximately 10% compared to the Base Case configuration.
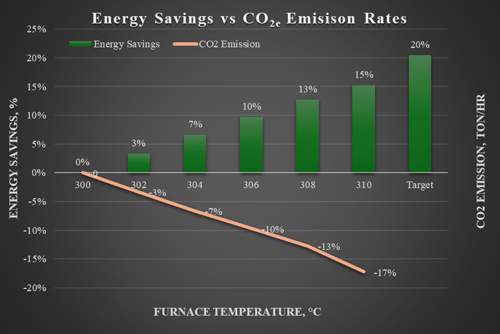
FIG. 11. Energy savings and CO2 emissions reductions for various HEN options.
Cost comparison of various HEN options. Several optimized HEN configurations were developed using the energy management softwareb to maximize energy savings. Among these, the most suitable option for project implementation was selected based on a comprehensive evaluation of both CAPEX and OPEX.
FIG. 12 illustrates the decision-making process, highlighting the selection of the HEN configuration with a fired heater inlet temperature of 304°C (579°F). This option offered a balanced trade-off between energy efficiency and cost. Beyond this temperature, achieving additional energy savings required the installation of significantly more heat transfer equipment, resulting in a disproportionate increase in CAPEX. As a result, the 304°C (579°F) configuration was identified as the most cost-effective and practical solution for execution.

FIG. 12. CAPEX for various HEN options.
FIG. 12 illustrates the trend in CAPEX as the fired heater inlet temperature increases. Up to 304°C (579°F), CAPEX rises linearly, primarily due to the cost of expanding existing heat exchanger shells without the need for new units. However, beyond 304°C (579°F), achieving additional energy recovery requires the installation of new heat exchanger units, resulting in a steeper increase in CAPEX.
These new exchangers, located downstream of the preflash tower, recover heat from high-temperature streams such as gasoils and vacuum residue. Due to the elevated temperatures and corrosive nature of these streams, construction requires high-grade materials like stainless-steel alloys, significantly increasing equipment costs. Additional expenses include plot space requirements, design modifications and schedule delays associated with procurement and installation of new equipment.
As a result, the design with a fired heater inlet temperature of 304°C (579°F) was selected for implementation. This configuration offers an optimal balance between energy savings and capital investment.
The selected design demonstrates that:
- A 4°C (39°F) increase in fired heater inlet temperature [from 300°C (572°F) to 304°C (579°F)] results in a 5.4% increase in CAPEX, while OPEX decreases by 4.7%.
- A 10°C (50°F) increase [from 300°C (572°F) to 310°C (590°F)] leads to a 48% increase in CAPEX, with only a 15% reduction in OPEX.
This clearly shows that beyond a certain point, incremental energy savings come at a disproportionately high CAPEX, making further optimization economically unviable.
FIG. 13 illustrates the relationship between CAPEX, OPEX and total annual cost. As OPEX and annual operating costs decrease, CAPEX increases. The annual cost is calculated based on a 5-yr payback period with a 10% return on investment (ROI), assuming 8,000 hrs of plant operation per year.
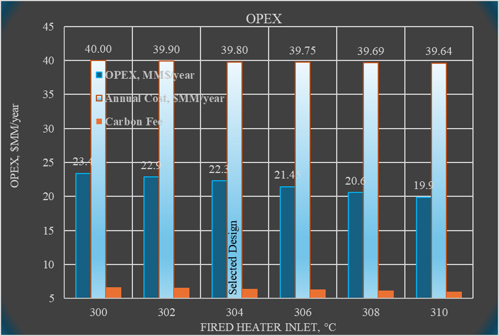
FIG. 13. OPEX and annualized cost for various HEN options.
FIG. 13 illustrates the decline in annual cost corresponding to the reduction in OPEX. The trend shows that annual cost continues to decrease as the fired heater inlet temperature increases, reaching its lowest point at 310°C (590°F) over a 5-yr evaluation period.
However, despite the continued cost savings, the 304°C (579°F) option was selected for implementation due to CAPEX constraints. This option offers a practical balance between energy efficiency and investment feasibility, aligning with the project's financial and operational objectives.
Emissions comparison of various HEN options. Achieving carbon neutrality is a key objective for any chemical process unit, though it often involves trade-offs in cost and design. For each HEN configuration evaluated, fired heater emissions were quantified in terms of carbon tax using the process simulation softwarea.
In the process simulation softwarea, carbon tax is calculated based on emissions generated by utility consumption, using emissions factors aligned with U.S. Environmental Agency (EPA) Rule E9-5711. For this analysis, a carbon fee of $36/t of CO₂ was applied to both hot and cold utility emissions for comparative purposes.2
The process simulation softwarea distinguishes between two types of CO2 equivalent (CO₂e) emissions:
- Scope 1 emissions represent direct process emissions, calculated as the net difference in carbon equivalents between inlet and outlet streams. Since the crude preheat train heat integration does not alter the process material balance, Scope 1 emissions remain unchanged.3
- Scope 2 emissions account for indirect emissions from stationary combustion, based on the type and quantity of fuel used for utilities.3
FIG. 14 presents the emissions rate and the corresponding carbon tax calculated by the process simulation softwarea for each HEN option. As utility consumption decreases, both emissions rate and carbon fee decline accordingly.
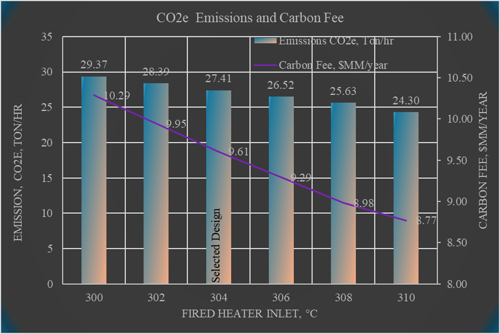
FIG. 14. CO2 emissions and carbon fee for various HEN options.
For the selected design with a fired heater inlet temperature of 304°C (579°F), the CO2e emissions were reduced from 29.37 t/hr to 27.41 t/hr, resulting in a decrease in annual carbon fee from $10.3 MM/yr to $9.6 MM/yr for the selected design. This represents an overall 6.7% reduction in both emissions and carbon-related costs, contributing significantly to the plant’s sustainability goals.
Net-zero carbon impact GHG emissions and strategies to mitigate the impact. Stationary combustion processes, such as those in fired heaters, contribute to nearly two-thirds of all CO2 emissions within a refinery. This makes the refining sector a prime candidate for implementing CO2 capture infrastructure to mitigate these emissions. Certain regions around the world are particularly well-suited for carbon capture and storage (CCS) operations due to unique geological features that allow for permanent CO2 storage, such as areas near depleted oil reserves. This proximity offers a significant opportunity for refineries in these regions to permanently sequester CO2 within sub-geological layers.1
Although this article addresses carbon emissions and carbon fees, it does not cover the methods and costs associated with capturing GHG emissions, as this project is not situated in a region where a carbon tax is imposed. The emissions cost benefits from emissions reduction of carbon capture are especially advantageous in countries that impose carbon taxes, such as Sweden, South Africa and Canada, to name a few.
Takeaway. Reducing the impact of GHG emitted to the atmosphere can be achieved through various methods. First, emissions can be minimized via process optimization and niche technologies that have already been proven effective. Secondly, carbon capture, utilization and sequestration (CCUS) and CCS can be employed. The first approach tackles emissions at their source, while the second captures them before they enter the atmosphere. When deciding between these methods, it is crucial to consider the associated costs, time requirements and any applicable carbon fees or taxes at the plant’s location. In short, opportunities for heat integration not only save energy, but also reduce carbon tax costs by lowering emissions.
NOTES
a Aspen HYSYS
b Aspen Energy Analyzer
LITERATURE CITED
- Van Straelen, J., et al., “CO2 capture for refineries, a practical approach,” International Journal of Greenhouse Gas Control, Vol. 4, Iss. 2, March 2010.
- Wikipedia, “Carbon fee and dividend,” online: https://en.wikipedia.org/wiki/Carbon_fee_and_dividend
- U.S. Environmental Protection Agency, “Greenhouse gas equivalencies calculator—Calculations and references,” 2024, online: https://www.epa.gov/energy/greenhouse-gas-equivalencies-calculator-calculations-and-references#:~:text=The%20Greenhouse%20Gas%20Equivalencies%20Calculator%20uses%20the%20AVoided%20Emissions%20and
The Authors

Amudha Narasimhan is a Senior Process Dynamic Simulation Specialist in the Integrated Solutions Americas at KBR in Houston, Texas (U.S.). With 25 yrs of industry experience, she brings deep expertise in process engineering and simulation, including steady-state, dynamic and transient studies. Her work spans a wide range of applications, from design verification to troubleshooting plant operations. Narasimhan holds an MS degree in chemical engineering from Anna University, India, and has a professional education certification in Clean Energy Solutions from the Massachusetts Institute of Technology (MIT) in the U.S.

Rick Northup is a Senior Process Manager in KBR’s Refinery Process Design group. He has more than 48 yrs of experience in refinery and petrochemical process design and technology licensing. In his current role, Northup oversees the process design activities for large grassroots and revamp refinery and petrochemical projects. He earned a BS degree in chemical engineering from Tulane University and an MS degree in chemical engineering from the University of Florida (U.S.).

Bingbing Zhang is a Senior Process Engineer within the Integrated Solutions group at KBR Technical Services Inc. She has more than 30 yrs of experience in refinery, liquefied natural gas (LNG), petrochemical and polymer process design, operation, revamp, optimization and troubleshooting. Zhang holds an MS degree in chemical engineering from Queen’s University, Canada.

Alex Pence is a Process Engineer within the Project Definition group at KBR. With more than 12 yrs of industry experience, he has worked in biofuels, LNG, ammonia, specialty chemicals, power generation, refining and olefins technologies with a particular focus in steady-state process simulation in pre-front end engineering and design (pre-FEED) designs. Pence holds a BS degree in chemical engineering from Texas A&M University and is a licensed Professional Engineer.

Juan Gomez Prado is a chartered Chemical Engineer with a strong technical background in the process design, evaluation, optimization and development of decarbonization projects, with more than 40 margin improvement program and projects for facilities worldwide.


Comments